

Sales Manager Summary Dashboard
Get a high-level view of sales performance to support better managerial decisions.
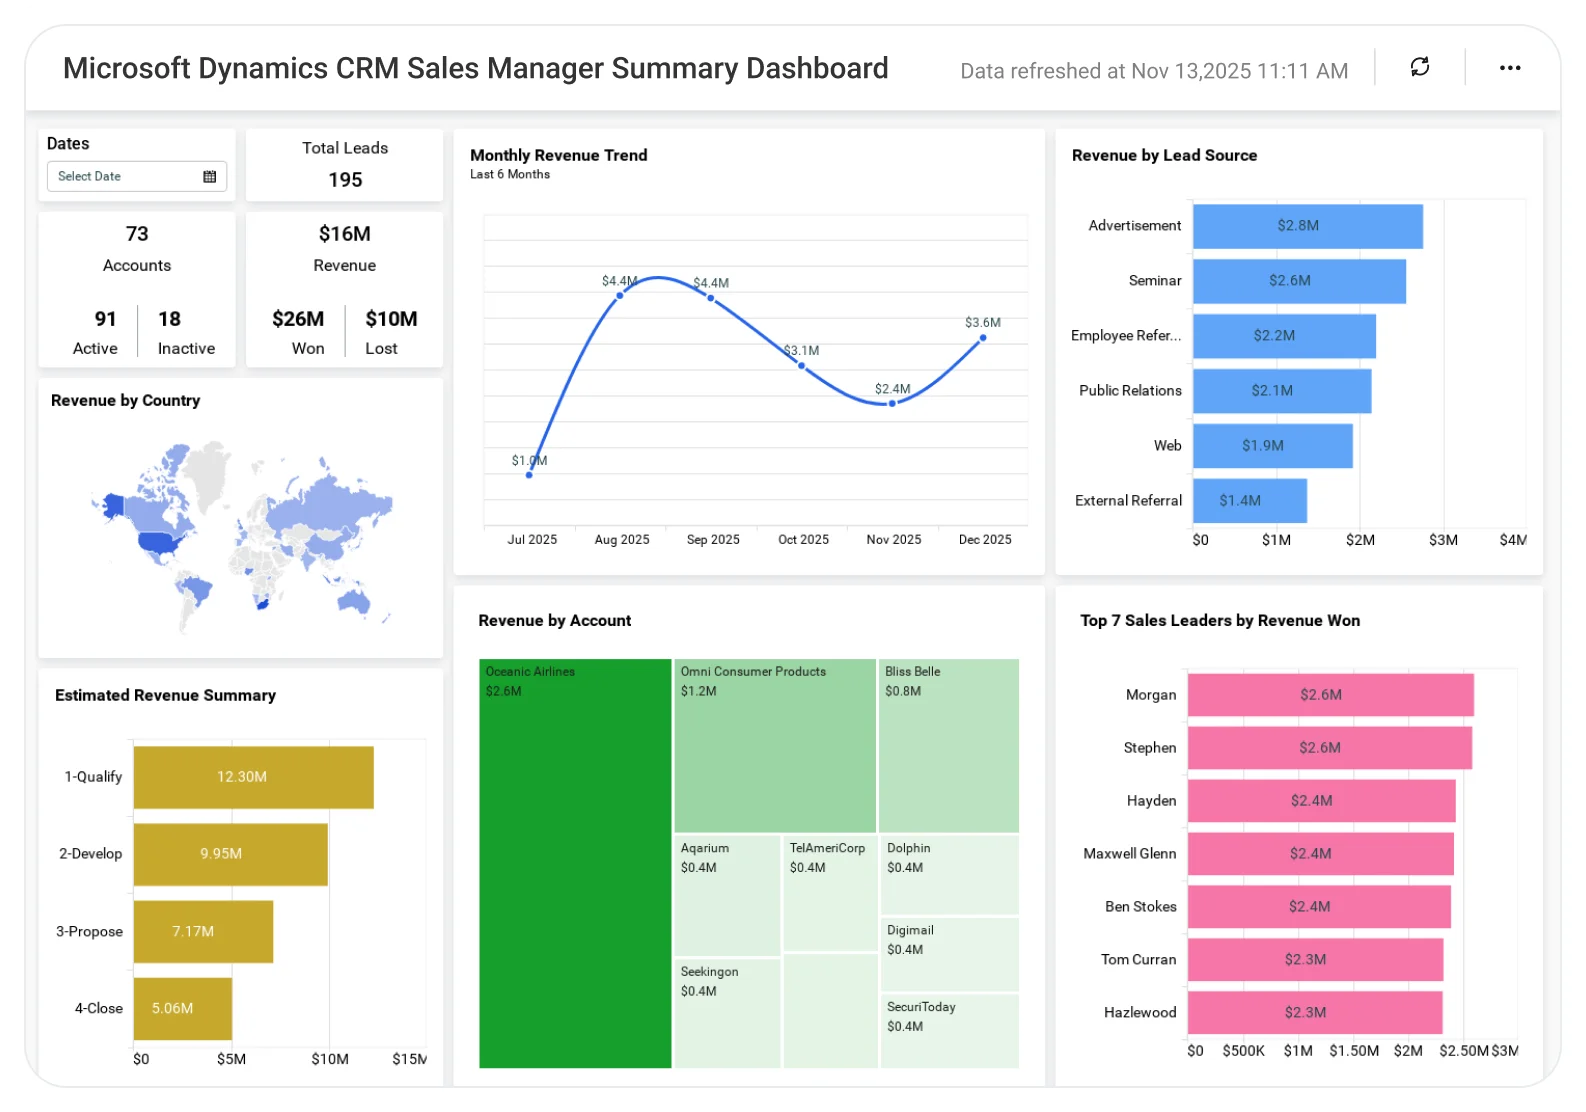
The Sales Manager Summary Dashboard helps sales managers analyze overall performance, team progress, pipeline status, and key metrics, enabling effective coaching, better planning, and improved sales results.
TL;DR
-
Total revenue and revenue trends.
-
Top-performing sales leaders.
-
Open opportunities and active leads.
-
Sales pipeline distribution by stage.
-
Revenue breakdown by country, company, and lead source.
What Is a Sales Manager Summary Dashboard?
A Sales Manager Summary Dashboard is an high-level analytics view that tracks revenue, leads, opportunities, pipeline stages, and sales performance metrics in one place.
In Bold BI, it becomes an interactive dashboard that supports fast decision-making, performance reviews, and short- and long-term sales planning.
Why Sales Manager Summary Dashboard Matters
Sales managers juggle performance tracking, pipeline reviews, and forecasting, often across disconnected tools and systems.
Without a unified summary dashboard:
-
Pipeline risks are harder to spot.
-
The top performers aren’t clearly visible.
-
Revenue trends lack context.
Bold BI centralizes critical sales data into one executive-ready view, helping leaders stay aligned and focused on revenue and pipeline performance.
What You’ll Track
Using Bold BI dashboards, you will track important sales manager summary KPIs such as:
-
Revenue & opportunity overview: Monitor total revenue, won and lost revenue, open opportunities, and lead volume.
-
Sales team performance: Identify top ten sales leaders and compare individual contribution to revenue.
-
Pipeline health: Analyze opportunity distribution across pipeline stages using a funnel view.
-
Revenue breakdowns: Review sales by country, company, and lead source to understand where revenue originates.
All dashboards are fully customizable, allowing you to add KPIs or metrics as needed.
How It Works
Why Bold BI Is the Right Fit for Sales Manager Summary Analytics
-
High-level sales performance tracking: Monitor team performance, quota attainment, and opportunity progress without visibility gaps.
-
Unified pipeline and revenue view: Track leads, pipeline health, deal progress, and revenue metrics in one dashboard.
-
Conversion and trend analysis: Analyze conversion rates and revenue trends to support better sales decisions.
-
Flexible performance breakdowns: Break down sales activities by region, product, or sales rep for deeper insights.
-
Secure and flexible deployment: Use enterprise-grade security with RLS, SSO, RBAC, audit logs, and deploy in cloud or self-hosted environments.
Compare Options (at a glance)
| Feature | Bold BI | Built-in CRM Dashboards | Spreadsheets |
|---|---|---|---|
| Unified view of pipeline, revenue, and activity | Yes | Limited | Manual |
| Team performance KPIs (quota attainment, win rate, ASP) | Yes | Partial | Manual |
| Forecast vs. target tracking (by rep/region/product) | Yes | Limited | Manual |
| Deal health & risk signals (stalled stages, aging, next steps) | Yes | Partial | Manual |
| Coaching insights (rep trendlines, conversion drop-offs) | Yes | Limited | Manual |
| Drilldowns from exec summary to rep/account detail | Yes | Limited | Manual |
| Custom KPIs & dashboards | Fully customizable | Fixed | Manual |
Frequently Asked Questions
More Articles About Sales Manager Summary Dashboard
-
Salesforce Analytics for Better Sales Growth
 This blog explains how Salesforce analytics in Bold BI helps drive sales growth by transforming sales and marketing data into interactive dashboards that track leads, opportunities, and revenue for better decision-making.
-
Visualize Sales Metrics with a Zoho CRM Dashboard
This blog explains how to use Bold BI to visualize key Zoho CRM sales metrics through an interactive sales dashboard, helping sales teams monitor performance and improve decision-making using interactive visual widgets.


